Advances in Concrete Construction, Vol. 6, No. 3 (2018) 245-268 245
DOI: https://doi.org/10.12989/acc.2018.6.3.245
Computation of stress-deformation of deep beam with openings using finite element method K. Senthil, A. Guptaa and S.P. Singhb Department of Civil Engineering, National Institute of Technology Jalandhar, Jalandhar, Punjab 144011, India
(Received October 10, 2017, Revised March 1, 2018, Accepted March 29, 2018) Abstract. The numerical investigations have been carried out on deep beam with opening subjected to
static monotonic loading to demonstrate the accuracy and effectiveness of the finite element based numerical models. The simulations were carried out through finite element program ABAQUS/CAE and the results thus obtained were validated with the experiments available in literature. Six simply supported beams were modelled with two square openings of 200 and 250 mm sides considered as opening at centre, top and bottom of the beam. In order to define the material behaviour of concrete and reinforcing steel bar the Concrete Damaged Plasticity model and Johnson-Cook material parameters available in literature were employed. The numerical results were compared with the experiments in terms of ultimate failure load, displacement and von-Mises stresses. In addition to that, seventeen beams were simulated under static loading for studying the effect of opening location, size and shape of the opening and depth, span and shear span to depth ratio of the deep beam. In general, the numerical results accurately predicted the pattern of deformation and displacement and found in good agreement with the experiments. It was concluded that the structural response of deep beam was primarily dependent on the degree of interruption of the natural load path. An increase in opening size from 200 to 250 mm size resulted in an average shear strength reduction of 35%. The deep beams having circular openings undergo lesser deflection and thus they are preferable than square openings. An increase in depth from 500 mm to 550 mm resulted in 78% reduced deflection. Keywords: deep beam; numerical studies; opening size; opening shape; opening location; span-depth ratio
1. Introduction Due to the strong growth in construction industry in many developing countries, deep beam design and its behaviour prediction is a subject of considerable relevance. Unlike shallow beams, in deep beams plane section do not remain plane in bending within in elastic stage and thus traditional design assumptions do not apply to them. The design of these structural elements is not adequately covered by existing codes of practices. Because of their geometry and load transfer mechanism, failure behaviour of deep beams is significantly different from that of shallow beams. In reinforced beams, utility pipes and service openings are usually placed below the beam soffit Corresponding author, Assistant Professor, E-mail:
[email protected];
[email protected] a M. Tech. Student, E-mail:
[email protected] b Professor, E-mail:
[email protected] Copyright © 2018 Techno-Press, Ltd. http://www.techno-press.org/?journal=acc&subpage=7
ISSN: 2287-5301 (Print), 2287-531X (Online)
246
K. Senthil, A. Gupta and S.P. Singh
and covered by suspended ceiling due to aesthetic purpose which will create a dead space. However, passing the pipes and openings through the transverse openings in the deep beams leads to a reduction in the dead space which may result into a more compact and economic design. The presence of openings in deep beams leads to many problems in the behaviour of the beam such as reduction in the beam strength and causes excessive cracking and deflection. Therefore, a detailed literature survey has been carried out to identify the gaps in the present study. Sachan and Rao (1990) conducted experiments on deep beams by varying the percentage of fibre content, amount of reinforcement and the type of loading. It was found that the addition of steel fibres to concrete results in a significant increase in ultimate strength of deep beams. Also it was observed that the failure of fibre reinforced concrete beams was more ductile and gradual compared with the failure of plain reinforced concrete beams. Rashid and Kabir (1996) conducted a total of fourteen deep beams against four point loading condition simulating the uniform distributed load. It was observed that the diagonal crack develops first in relatively deeper beams and flexural cracks develop first in the shallower beams. Mansur (1998) concluded that the inclusion of an opening in the web of an existing beam leads to early diagonal cracking and significantly reduces the beam shear capacity and stiffness. Yang et al. (2003) conducted tests on a total of twenty-one beam specimens to investigate the shear characteristics by varying the concrete strength, shear span/depth ratio and overall depth. It was concluded that by decreasing the shear span/depth ratio and by increasing the overall depth under the same shear span/depth ratio will lead to more brittle failure with wide diagonal cracks and high energy release rate related to size effects. Islam et al. (2005) observed that the use of a bonded fibre reinforced polymer system in deep beam leads to a much slower growth of the critical diagonal cracks and enhances the load carrying capacity of the beam. Yang et al. (2006) observed that the effect of variation in concrete strength on the ultimate shear strength was significantly less in deep beams with openings rather than solid deep beams. It was evaluated that in deep beam with openings, the strength of a compressive concrete strut increased at a lower rate with the increase in concrete strength. Yang and Ashour (2007) observed that larger diagonal crack width appeared in beams having web openings within interior shear spans than in beams having web openings within exterior shear spans which showed the closest diagonal crack width to that of their companion solid beams. Kim et al. (2011) carried out experiments on deep reinforced concrete beam under combined axial and bending loads. It was observed that the deep beam with shear span/depth ratio of 0.5, load at the beam failure decreases as applied axial load increases, while the deep beams with shear span/depth ratios of 1.0 and 1.5 showed that the applied axial load delays the beam failure. Additionally, failure mode of the deep beam changes from shear failure to concrete crushing due to compressive stress at the top corners of reinforced concrete beams as shear span/depth ratio decreases. Campione and Mianfo (2012) concluded that the failure mode and first cracking load is dependent on the presence and position of the opening, like if the opening is placed in the mid span section it does not influence the response of the beam and if the opening is placed within the shear span, a reduction in load-carrying capacity occurs in the range 18-30%. Chin and Doh (2015) conducted experiments on deep beam with circular and square openings to study the behaviour of reinforced concrete deep beams. It was concluded that circular openings are more suitable option than square openings. Zhao et al. (2004) studied the nonlinear behaviour and failure characteristics of deep reinforced concrete coupling beams under monotonic loading condition by applying the nonlinear finite element method. It was concluded that the flexural cracks formed at the tension sides of the beam wall joints and the diagonal shear cracks formed near the centre would jointly govern the nonlinear behaviour and failure characteristics of a coupling beam. It was also observed that after formation of the diagonal shear cracks, the coupling beam behaved more like a truss consisting of a diagonal concrete strut and the longitudinal reinforcing bars.
Computation of stress-deformation of deep beam with openings using finite element method
247
Hawileh et al. (2012) studied the response of carbon fibre reinforced polymer strengthened reinforced concrete deep beams with openings using the finite element package ANSYS and compared with the available experiments carried out by Maaddawy and Sherif (2009). The developed finite element models accounted for the interfacial behaviour between the concrete and CFRP. The crack patterns predicted by the finite element models were in good agreement with those observed experimentally. Excellent correlation between numerical and experimental load deflection curves was recorded. Alsaeq (2013) observed that the opening location has more effect on the structural strength than the opening shape. Also, placing the openings near the upper corners of the deep beam may double the strength, and the use of a rectangular narrow opening, with the long sides in the horizontal direction, can save up to 40% of structural strength of the deep beam. Mohamed et al. (2014) observed that the depth of the opening is the most important parameter influencing the overall capacity of the beam. Demir et al. (2016) proposed a numerical finite element model, as well as a reliable finite element modelling technique and constitutive material models to simulate nonlinear behaviour of reinforced concrete deep beams. The results demonstrated that finite element analysis is a highly effective and consistent tool to simulate nonlinear behaviour of reinforced concrete deep beams. In addition to that many studies found on finite element modelling of deep beams and ductile and non-ductile reinforced concrete elements (Ibrahimbegovic 1990, Foster 1990, Ibrahimbegovic and Wilson 1991, Foster 1992, Winnicki and Cichon 1995, Yoo and Banthia 2015, Senthil et al. 2016a, b, 2017). Based on a detailed literature survey, it is observed that the behaviour of deep beams containing openings loaded up to failure through finite element analysis is limited. Also, the identification of the constitutive and fracture model to represent the nonlinear behaviour of reinforced concrete deep beams heretofore is limited. The robust finite element analysis in terms of simulating nonlinear behaviour of reinforced concrete deep beams with different size, shape and location of opening is also found limited. In the present study, the numerical investigations were carried out on reinforced concrete deep beam with circular and square opening against static loading to demonstrate the accuracy and effectiveness of the finite element based numerical models. The simulations were carried out through finite element program ABAQUS/CAE. Six simply supported beams with two openings of 200 and 250 mm sides opening at centre, top and bottom of the beam were considered for validation studies. The results thus obtained were validated with the experiments, Maaddawy and Sherif (2009). In addition to that, Seventeen beams instead of fourteen beams were simulated for studying the effect of opening location, size and shape and depth, span and shear span to depth ratio of the deep beam.
2. Numerical modelling The numerical investigations were carried out using the commercial finite element tool ABAQUS/Explicit finite element code. The deep beams with tensile and shear reinforcement have been modelled and the constitutive behaviour was employed to predict the material behaviour of concrete and steel bar and discussed in the present Section. The mesh convergence study was also carried out and discussed under this section. 2.1 Modelling of deep beams The numerical investigations were carried out to study the behaviour of reinforced concrete deep beam subjected to monotonic loading using ABAQUS/CAE. The detailing of reinforcement
248
K. Senthil, A. Gupta and S.P. Singh
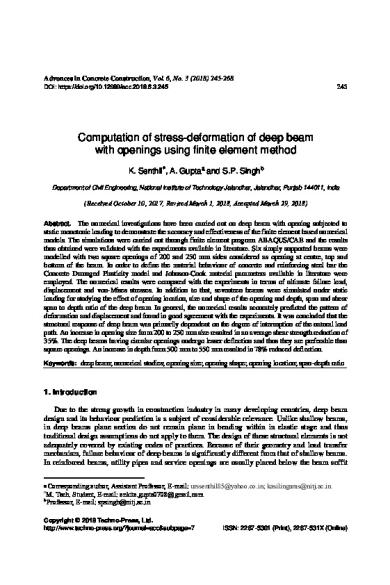
Fig. 1 Details of deep beam, Maaddawy and Sherif (2009)
(a)
(b)
(c)
Fig. 2 Schematics of beams with openings (a) B1-200C (b) B3-200T (c) B5-200B, Maaddawy and Sherif (2009)
bar, cross section and length of the beam were considered equivalent to the experiments by Maaddawy and Sherif (2009) and schematics of the specimen is shown in Fig. 1. The total length of specimen was 1200 mm with a rectangular cross section of 80×500 mm. The beam had an effective span of 1000 mm and thus a span to depth ratio (l/h ratio) of 2. The tension steel reinforcement consisted of four numbers of 14 mm diameter deformed steel bars each had a nominal cross sectional area, Ab=154 mm2. The compression steel reinforcement consisted of two numbers of 8 mm diameter deformed steel bars with Ab=50 mm2. The web reinforcement consisted of 6 mm diameter smooth bars, with Ab=28 mm2, spaced at 150 mm in both vertical and horizontal directions. The vertical web reinforcement was in the form of stirrups while the horizontal web reinforcement was provided in the form of longitudinal bars on both sides of the beam. A clear cover of 15 mm was maintained at the top and bottom of the beam whereas a clear cover of 10 mm was maintained on the vertical sides of the beam. The beams considered in first phase named as B1-200C, B2-250C, B3-200T, B4-250T, B5200B and B6-200B were modelled to study the effect of varying size and location of opening. The notations in the identity of beam was followed as “B1, B2, B3 upto B23” for “Beam with serial number”, whereas “200” and “250” depict the size of opening i.e., 200×200 mm and 250×250 mm. The location of opening in the beam was followed as “C for centre”, “T for top” and “B for bottom” see Fig. 2. All specimens had two square openings, one in each shear span and placed symmetrically about the mid-point of the beam and the sides are denoted as “a”. The opening size was either 200×200 mm or 250×250 mm which corresponding to opening height/depth (a/h) ratios of 0.4 and 0.5 respectively. The beams considered in second phase named as B7-200C, B8-200T and B9-200B, B15-200C, B16-200T and B17-200B, B21-200C, B22-200T and B23-200B, see Fig. 3, were modelled to study the effect of varying depth of beam i.e., 550, 600 and 800 mm
Computation of stress-deformation of deep beam with openings using finite element method
(a)
(b)
249
(c)
Fig. 3 Typical solid body of beam (a) B1-200C (b) B3-200T and (c) B5-200B
(a)
(b)
Fig. 4 Typical solid body of beam (a) B13-200C and (b) B14-250C
respectively. The beams considered in third phase named as B10-200C, B11-200T and B12-200B, B18-200C, B19-200T and B20-200B, see Fig. 3, were modelled to study the effect of varying span of beam i.e., 1200 and 1800 mm. The beams considered in fourth phase named as B13-200C and B14-250C were modelled to study the effect of varying diameter of circular opening in the beam, see Fig. 4. The finite element model of reinforced concrete deep beam was made using ABAQUS/CAE. The concrete was modelled as three dimensional deformable body and the reinforcement as three dimensional truss. The interaction between concrete and steel was modelled using the tie constraint option available in ABAQUS/CAE wherein the concrete was assumed as host region and the steel as embedded region. The degree of freedom of the steel was governed by the nearest concrete node. The element types used in finite element model for concrete was 8-noded linear bricks and reinforcement steel bar was a 2-noded linear three dimensional truss. The beam boundaries of two ends was restrained with respect to all the degree of freedom. The loading applied was linearly varied to a maximum value till the failure occurred in the beam. 2.2 Constitutive modelling In finite element modelling, inelastic behaviour of concrete was defined to the model by using concrete damaged plasticity model (CDP) providing a general capability for modelling concrete and other quasi-brittle materials. The plastic-damage model is a form of classical plasticity theory in which a plastic-damage variable „K‟ is defined which increases if and only if plastic deformation takes place. Moreover, the plastic-damage variable is limited to a maximum value and the attainment of this value at a point of the solid represents total damage, which can be interpreted as the formation of a macroscopic crack. The variable “K” is non-dimensional and its maximum value is unity. The concrete damaged plasticity model is a continuum, plasticity-based, damage model for concrete. The model assumes that the two main failure mechanisms are tensile cracking and compressive crushing of the concrete material. The evolution of the yield surface is controlled by two hardening variables which are linked to failure mechanisms under tension and compression loading, namely εcpl and εtpl are compressive and tensile equivalent plastic strains, respectively. The
250
K. Senthil, A. Gupta and S.P. Singh Table 1 Compressive damage variables for CDP model Yield Stress (MPa) 21 20 19
Inelastic Strain 0 0.0011 0.004
Damage Parameter (dc) 0 0.2 0.5
Table 2 Tensile damage variables for CDP model Yield Stress (MPa) 3.3 3.2 3.1 3.0 2.95
Cracking Strain 0 0.003 0.005 0.007 0.01
Damage Parameter (dt) 0 0.5 0.55 0.61 0.67
Table 3 Concrete damaged plasticity model values of concrete Description Elastic Modulus, E (GPa) Dilation Angle Flow Potential Eccentricity Viscosity Parameter K fbo/fco
Numerical value 24 30 1 0.1 0.666 1.16
damage variables can take values from zero to one, where zero represents the undamaged material and one represents total loss of strength. The stress strain relations under uniaxial compression and tension loading are given by the following equations where Eo is the initial (undamaged) elastic stiffness of the material: σt=(1-dt)Eo(εt-εtpl) and σc=(1-dc)Eo(εc-εcpl), where dt and dc are tension damage variable and compression damage variable respectively, see Fig. 5(a)-(b). The concrete damaged plasticity model parameters such as (dt) tension and (dc) compression damage variables are shown in Tables 1 and 2. The compressive strength of concrete was 21 MPa by Maaddawy and Sherif (2009). The Poisson‟s ratio of the concrete was assumed equal to 0.2. The parameters for CDP model other than damage variables are shown in Table 3, available in Iqbal et al. (2012). The flexural steel reinforcement grade Fe420 and the web shear reinforcement grade Fe300 were considered in the present study is same to that of Maaddawy and Sherif (2009). The yield strengths of the flexural and shear steel reinforcements were 420 MPa and 300 MPa, respectively. Therefore, to define the material behavior of reinforcing steel bar the Johnson-Cook material parameters available in literature proposed by Iqbal et al. (2012 and 2015) was used in the present study. In order to define the material behavior of steel reinforcing bar the Johnson-Cook (1983, 1985) elasto viscoplastic material model available in ABAQUS finite element code was employed. The equivalent von- Mises stress of the Johnson-Cook model is defined as ̅ ̅
̇
̂
[
̅
]*
(
̇ ̇
)+ [
̂ ]
(1)
Computation of stress-deformation of deep beam with openings using finite element method
(a)
251
(b)
Fig. 5 Response of concrete to uniaxial loading in (a) compression and (b) tension, ABAQUS (2008)
where A, B, n, C and m are material parameters determined from different mechanical tests such as low, medium and high strain rate tension test subjected to low, medium and elevated temperature as well as test on smooth and notched cylindrical specimens. ̅ is equivalent plastic strain, ̇ is equivalent plastic strain rate, ̇ is a reference strain rate and ̂ is non-dimensional temperature defined as ̂
⁄
(2)
where T is the current temperature, is the melting point temperature and is the room temperature. The Johnson and Cook (1985) extended the failure criterion proposed by Hancock and Mackenzie (1976) by incorporating the effect of strain path, strain rate and temperature in the fracture strain expression, in addition to stress triaxiality. The strain at failure ̅ is assumed to be dependent on a non-dimensional plastic strain rate,
̇
; a dimensionless pressure-deviatoric stress ̇
is the mean stress and ̅ is the equivalent von-Mises stress) and the nondimensional temperature, ̂ , defined earlier in the Johnson-Cook hardening model. The dependencies are assumed to be separable and are of the form ratio,
̅
(where
̅
̇ ̅
̂
*
(
̅
)+ *
(
̇ ̇
)+ [
̂]
(3)
where, are damage parameters, ̇ is equivalent plastic strain rate and ̇ is a reference strain rate. When material damage occurs, the stress-strain relationship no longer accurately represents the material behaviour, ABAQUS (2008). The Johnson-Cook model parameters for steel reinforcing bar employed in the finite element modelling is shown in Table 4. 2.3 Mesh convergence study The mesh sensitivity in the reinforced concrete deep beam was studied by varying the element size in the entire region of the beam of B2-250C, B4-250T and B6-250B. The size of element was
252
K. Senthil, A. Gupta and S.P. Singh
Table 4 Johnson-cook model parameters for steel Fe 420 and Fe300 Material Parameters D1 D2 D3 D4 D5 Melting Temperature (K) Transition Temperature (K) Reference strain rate (s-1) A (MPa) B (MPa) C n m
(a)
Numerical value Fe420 (Iqbal et al. 2012) Fe300 (Iqbal et al. 2015) 0.0705 0.1152 1.732 1.0116 -0.54 -1.7684 -0.015 -0.05279 0 0.5262 1800 1800 293 293 0.0005 0.0001 490 304 383 422 0.0114 0.0156 0.45 0.345 0.94 0.87
(b)
Fig. 6 Typical finite element model with mesh size of 20 mm (a) concrete and (b) steel reinforcement
carefully chosen based on the mesh convergence studied for concrete whereas for reinforcement the size of the element was kept constant, 20 mm. The mesh sensitivity in the concrete was studied by varying the element size as 40, 30 and 20 mm3. The typical finite element model of deep beam and reinforcement were shown in Fig. 6. The mesh convergence study was performed on three beam specimens B2-250C, B4-250T and B6-250B by varying mesh sizes 40, 30 and 20 mm and the mid-span deflection was obtained is shown Table 5. The maximum displacement of the beam B2-250C was found to be 1.72, 3.74 and 6.08 mm by varying the mesh size as 40, 30 and 20 mm respectively, see Fig. 7. It was observed that the deflection of beam was found to be increased by reducing the mesh and overall the predicted deflection corresponding 20 mm mesh size was found in agreement with the experiments. The actual and predicted maximum central deflection of B2250C beam at 20 mm mesh size was found to be 5.7 and 6.08 mm respectively. Similarly, the actual and predicted maximum central deflection of B2-250T beam at 20 mm mesh size were found to be 2.9 and 2.3 mm respectively. Also, the actual and predicted maximum central deflection of B2-250B beam at 20 mm mesh size was found to be 4.1 and 3.5 mm respectively.
Computation of stress-deformation of deep beam with openings using finite element method
(a)
253
(b)
(c) Fig. 7 Deformation of beam B2-250C having mesh size of (a) 40, (b) 30 and (c) 20 mm Table 5 Mid span deflection beams function of mesh sizes Designation B2-250C B4-250T B6-250B
Numerical results (mm) 40 mm 30 mm 20 mm 1.726 3.738 6.085 1.735 1.984 2.305 2.317 2.734 3.517
Experimental results (mm) 5.7 2.9 4.1
Therefore, it was concluded that 20 mm mesh size resulting most accurate results and thus it is selected as the standard mesh size to model all the remaining deep beams.
3. Comparison of numerical and experimental results The simulations were performed on six simply supported beam, i.e., B1-200C, B2-250C, B3200T, B4-250T, B5-200B and B6-200B configurations against static monotonic loading. The numerical results thus obtained for the beams with opening of varying sizes and locations have been compared with the experiments reported in the literature, Maaddawy and Sherif (2009). The maximum load carrying capacity of the given beams has been obtained numerically at a specified
254
K. Senthil, A. Gupta and S.P. Singh
(a)
(b)
(c)
(d)
(e)
(f) Fig. 8 Deformed profile of experiments and simulations of beam (a) B1-200C (b) B2-250C (c) B3-200T (d) B4-250T (e) B5-200B and (f) B6-250B
Computation of stress-deformation of deep beam with openings using finite element method
255
Table 6 Comparison of experiments and simulations in terms of failure load Designation B1-200C B2-250C B3-200T B4-250T B5-200B B6-250B
Failure load (kN) Exp. FE 165 170.7 110 108.9 220 219.4 110 116.9 210 198.9 140 147.7
Percentage of deviation between experiment and simulation ((FE/Exp.)-1) 3.45 (Over predicted) 1.00 (under predicted) 0.27 (under predicted) 6.27 (Over predicted) 5.28 (under predicted) 5.5 (Over predicted)
load in the experiments is compared and discussed. The resistance of the deep beam studied in terms of ultimate failure load, maximum vertical deflection and von-Mises stresses has been compared and discussed. 3.1 Ultimate failure load The response of six reinforced concrete deep beams with two different opening sizes were studied and compared in terms of ultimate failure load. The failure loads of experimental and numerical results for B1-200C, B2-250C, B3-200T, B4-250T, B5-200B and B6-200B configurations were shown in Table 6. The resistance offered by the beam B3-200T was found highest whereas B4-250T was lowest among six beams. In general, a maximum deviation of 6.27% has been found between the actual and predicted failure loads of B4-250T beams. The predicted failure load of beam B3-200T was found exactly same i.e., 219.4 kN, as similar to the experiments i.e., 220 kN and this result was also witnessed through finite element simulations, see Fig. 8(c). The actual and predicted deformation of the beam as a result of cracks has been compared in Fig. 8. The deformed profile of the experiments of B1-200C was not available, therefore only simulated deep beam was shown in Fig. 8(a). However, the numerical simulation results of failure loads corresponding to the specimens B1-200C have been obtained and the results have been found to have a close correlation with the actual results, see Table 6. The predicted and measured failure load of B1-200C was found to be 170 and 165 kN respectively. An exact pattern of deformation has been predicted through the finite element simulations, see Fig. 8(b)-(c). The simulations predicted the deformation profile accurately, however the chipping of the material could not be predicted in the simulations. The predicted stress contours also suggested very high stresses in the path along the crack adjoining to the opening. The sign of cracks of all the beam have also been observed at both the side of the beam. The stress concentration for the beam B5200B was predicted through simulations and it was observed to be maximum at just above the opening, see Fig. 8(e), and the results are similar to the experiments. Also, the stress concentration was observed maximum at bottom right corner of the right side opening and this finding was also witnessed through finite element simulations. In case of beam B6-250B, the stress concentration predicted through simulations was found maximum at just above both the opening which is similar to the experiments, see Fig. 8(f). The stress concentration was observed maximum at bottom left corner of the left side opening and this result was also witnessed through finite element simulations.
256
K. Senthil, A. Gupta and S.P. Singh
Table 7 Comparison of experiments and simulation in terms of mid span deflection Mid span deflection (mm) Exp. FE 4.2 4.6 5.7 6.1 3.2 3.0 2.9 2.3 3.2 3.5 4.1 3.52
Designation B1-200C B2-250C B3-200T B4-250T B5-200B B6-250B
Percentage of deviation between experiment and simulation ((FE/Exp.)-1) 9.52 (Over predicted) 7.02 (Over predicted) 6.25 (under predicted) 20.0 (under predicted) 9.40 (under predicted) 14.1 (under predicted)
(a)
(b)
(c)
(d)
(e)
(f)
Fig. 9 Deflection of beam (a) B1-200C (b) B2-250C (c) B3-200T (d) B4-250T (e) B5-200B and (f) B6-250B
257
Computation of stress-deformation of deep beam with openings using finite element method 200
120 90 Load (kN)
Load (kN)
160 120 80
60 30
40
EXPERIMENTAL RESULT
EXPERIMENTAL RESULT
FE ANALYSIS
0 0
2 4 Displacement (mm)
FE ANALYSIS
0 6
0
2 4 6 Displacement (mm)
(a)
(b) 160
250 200
120 Load (kN)
Load (kN)
8
150 100
80 40
50
FE ANALYSIS
EXPERIMENTAL RESULT
EXPERIMENTAL RESULT
FE ANALYSIS
0 0
1 2 3 Displacement (mm)
0 4
0
1 2 3 Displacement (mm)
(c)
4
(d)
240
160
200 Load (kN)
Load (kN)
120 160 120 80
80 40
40
EXPERIMENTAL RESULT FE ANALYSIS
EXPERIMENTAL RESULT FE ANALYSIS
0 0
1 2 3 Displacement (mm)
(e)
0 4
0
1
2 3 4 Displacement (mm)
5
(f)
Fig. 10 Comparison of load versus deflection between experiments and simulations of the beam (a) B1-200C (b) B2-250C (c) B3-200T (d) B4-250T (e) B5-200B and (f) B6-250B
3.2 Maximum vertical displacement The vertical displacement of experimental and numerical results for B1-200C, B2-250C, B3200T, B4-250T, B5-200B and B6-200B configurations were shown in Table 7. The contour plots of the displacement shown in Fig. 9 describe the maximum vertical displacement in the deep beam. The pattern of the vertical displacement however was found same in all six beams. The
258
K. Senthil, A. Gupta and S.P. Singh
predicted and measured vertical displacement of B1-200C was found to be 4.687 and 4.2 mm respectively, which is clearly seen in Fig. 9(a). Similarly the vertical displacement of remaining beams (B2-B6) was measured experimentally and the results were also witnessed through finite element simulations, see Fig. 9(b)-(f). In general, a maximum deviation of 20% has been found between the actual and predicted vertical displacement of B4-250T beam. The deflection of beam B1 and B2 was found to be over predicted whereas the beam B3-B6 was found under predicted. The vertical displacement of beam B2-250C was found highest whereas B4-250T was found lowest among the six beams. 3.3 Load versus displacement The load versus deflection of beam B1-200C, B2-250C, B3-200T, B4-250T, B5-200B and B6200B configurations predicted numerically was compared with the experiments, see Fig. 10. In general, a close correlation between the experimental results and the predicted results of load versus deflection has been found. The experiment and numerical results of deflections were found in close agreement for beam B1-200C, B2-250C and B3-200T configuration. For B4-250T, B5200B and B6-200B configurations, the numerical results of deflections are over predicted almost 20, 9.5 and 14% as compared to experimental results respectively. 3.4 von-Mises stresses The von-Mises stresses developed in reinforced concrete deep beam have been shown in Fig. 11. At left side shear span of the beam, the maximum compression has been found to develop near the top left and bottom right corner of opening while maximum tension is found near the top right and bottom left corner of opening. At right side shear span of the beam, the maximum compression has been found to develop near the top right and bottom left corner of opening while maximum tension near the top left and bottom right corner of opening. Therefore, in the left side shear span, cracks started from the point of loading to the top right corner of the opening and then from bottom left corner of the opening travelled up to the support. For right side shear opening, cracks started from the point of loading to the top left corner of the opening and then from bottom right corner of the opening travelled up to the support. In general, both the compressive and tensile stresses were found to increase with an increase in the size of the opening. The stress in the beam was found to be matching with concrete compressive strength of 25.7, 23.2, 29.3, 30.7, 22.1 and 32.2 MPa, see Fig. 11.
4. Results and discussion The simulations were performed on seventeen reinforced cement concrete deep beams against static monotonic loading. The parameters such as opening location, size and shape of the opening and depth, span and shear span to depth ratio of the deep beam have been studied. The responses of deep beam against varying parameters were studied and compared in this Section. 4.1 Location of opening The location of the openings in the deep beams was varied and its effect on the load carrying
Computation of stress-deformation of deep beam with openings using finite element method
(a)
(b)
(c)
(d)
(e)
(f)
259
Fig. 11 Von-Mises stress of beam (a) B1-200C (b) B2-250C (c) B3-200T (d) B4-250T (e) B5-200B and (f) B6-250B
capacity was studied. Fig. 12 shows the deformed profile of beams B1-200C, B3-200T, B5-200B, B2-250C, B4-250T and B6-250B. The maximum deflection of beam B1, B3 and B5 was found to be 4.68, 3.07 and 3.53 mm respectively. It was observed that the deflection of beam B3 and B5 configuration was found to decrease by 35 and 25% compared to B1 configuration. Similarly, the maximum deflection of beams B2, B4 and B6 was found to be 6.08, 2.30 and 3.51 mm respectively. It was observed that the deflection of beams B4 and B6 configuration was found to decrease by 62 and 42% compared to B2 configuration. The load carrying capacity of the beams B1-B6 configuration having openings in different locations has been compared, see Fig. 13. The failure load of beams B1, B3 and B5 configuration was found to be 170, 219 and 198 kN respectively. Similarly, the failure load of B2, B4 and B6 configuration was found to be 108, 117 and 147 kN respectively. It was also observed from Fig.
260
K. Senthil, A. Gupta and S.P. Singh
(a)
(b)
(c)
(d)
(e)
(f)
Fig. 12 Deflection of beam (a) B1-200C (b) B3-200T (c) B5-200B (d) B2-250C (e) B4-250T and (f) B6250B 250
150 (a)
(b)
120 Load (kN)
Load (kN)
200 150 100 B1-200C B5-200B B3-200T
50 0 0
1
2 3 Deflection (mm)
4
90 60 B2-250C B4-250T B6-250B
30 0 5
0
2
4 6 Deflection (mm)
8
Fig. 13 Effect of (a) 200 and (b) 250 mm opening size
13, that the load carrying capacity was least for beams B1-200C and B2-250C. The reason may be due to the maximum interception of the load path occurs when openings were provided at the centre of the shear span. Therefore, it was concluded that beams having openings in the centre of the shear span may be least preferable. 4.2 Size of opening The size of openings in the deep beams was varied and its effect was studied in terms of carrying capacity and deflection. Fig. 14 shows the load versus deflection of beams with 200 and 250 mm opening located at centre, top and bottom. The load carrying capacity of beam having opening of 200 and 250 mm at centre was found to be 170 and 108 kN respectively, see Fig. 14(a). Similarly, the ultimate failure load of beam having opening of 200 and 250 mm located at top was
Computation of stress-deformation of deep beam with openings using finite element method
(a)
80
0 0
2 4 6 Deflection (mm)
150
150
100
100 50
B1-200C B2-250C
50
B3-200T B4-250T
0 8
(c)
200 Load (kN)
120
40
(b)
200 Load (kN)
160 Load (kN)
250
250
200
261
0
1 2 3 Deflection (mm)
B5-200B B6-250B
0 4
0
1 2 3 Deflection (mm)
4
Fig. 14 Load versus deflection of the beam having opening at (a) centre (b) top and (c) bottom
(a)
(b)
(c) Fig. 15 Deflection of beam (a) B7-200C (b) B8-200T and (c) B9-200B
found to be 219 and 117 kN respectively, Fig. 14(b). Also, the failure load of beam having opening of 200 and 250 mm located at bottom was found to be 198 and 147 kN respectively, Fig. 14(c). It was observed that the failure load of beam with 250 mm opening at centre, top and bottom was found decreased by 36, 46 and 26% respectively, compared to the beam with 200 mm opening at centre, top and bottom. Overall, an increase in opening size from 200 to 250 mm resulted in an average shear strength reduction by 35%. The reason may be due to increase in size of the opening at the centre of beam, decreased the stiffness of the beam and thus it underwent more deflection. However, the deflection of beam B4 was found decreased significantly as compared to beam B3, whereas the deflection in beam B6 was found same as compared to B5. 4.3 Effect of varying depth The depth of deep beam was varied as 500, 550, 600 and 800 mm and its effect was studied in
262
K. Senthil, A. Gupta and S.P. Singh
150 Load(kN)
120
250
200
200
(b)
Load(kN)
(a)
250
150
90
Load(kN)
180
100
60 B7200C(Depth=550mm)
30 0
50
B8200T(Depth=550mm)
2 4 Deflection(mm)
6
0
1
2 3 Deflection(mm)
150 100 50
0 0
(c)
4
B9200B(Depth=550mm)
0 0
1
2 3 Deflection(mm)
4
Fig. 16 Load versus deflection of beams of varying depth having opening at (a) centre (b) top and (c) bottom Table 8 Mid span deflection of beams of varying depth Beam B1-200C B7-200C B15-200C B21-200C B3-200T B8-200T B16-200T B22-200T B5-200B B9-200B B17-200B B23-200B
Depth (mm) 500 550 600 800 500 550 600 800 500 550 600 800
Mid span deflection (mm) 4.6 1.0 0.4 0.24 3.0 0.9 0.4 0.21 3.5 1.0 0.5 0.23
terms of load carrying capacity and deflection. The beams considered were B7-200C, B8-200T and B9-200B against 550 mm depth. Similarly, B15-200C, B16-200T and B17-200B, B21-200C, B22-200T and B23-200B were modelled against 550, 600 and 800 mm depth respectively. However, Fig. 15 shows the typical deformed profile of beams of 550 mm depth having opening at centre, top and bottom. It was observed that the deflection of beams B7, B8 and B9 was found to be 1.02, 0.92 and 1.03 mm which is almost same whereas, the deflection of beams B1, B3 and B5 was found to be 4.6, 3.0 and 3.5 mm respectively. Therefore, it is concluded that when the beam depth increases from 500 to 550 mm, the deflection of the beam was found decreased significantly. Fig. 16 presents the load versus deflection curve of beam with depths of 500 and 550 mm having opening at centre, top and bottom. The deflection of 500 mm depth beam having opening at centre, top and bottom was 4.6, 3.0 and 3.5 mm respectively. Similarly, the deflection of 550 mm depth beam having opening at centre, top and bottom was 1.02, 0.92 and 1.03 mm respectively. It has been clearly seen that when the depth of the beam is increased from 500 mm to 550 mm, the deflection of the beam was reduced about 78% irrespective of location of openings. Table 8 shows the mid span deflection of beam depths of 500, 550, 600 and 800 mm. As expected, the deflection was found lesser for beams having greater depths. The deflection of 550, 600 and 800 mm deep
Computation of stress-deformation of deep beam with openings using finite element method
(a)
263
(b)
(c) Fig. 17 Deflection of beam (a) B10-200C (b) B11-200T and (c) B12-200B
beam was found to decrease by 78, 91 and 95% respectively as compared to 500 mm deep beam opening at centre. The reason may be due to the increase in stiffness of beam due to the increase in cross-sectional area of the beam and thus beam underwent less deflection. 4.4 Varying span The span of deep beam was varied as 1000, 1200 and 1800 mm and their effect was studied in terms of load carrying capacity and deflection. The beams considered were B10-200C, B11-200T and B12-200B against 1200 mm. Similarly, B18-200C, B19-200T and B20-200B were modelled against 1800 mm. Fig. 17 shows the typical deformed profile of beams of 1200 mm span having opening at centre, top and bottom. It was observed that the deflection of beams B10, B11 and B12 was found to be 8.78, 9.20 and 9.07 mm respectively whereas the beams B1, B3 and B5 was found to be 4.6, 3.0 and 3.5 mm respectively. Therefore, it is concluded that when the beam span increases from 1000 to 1200 mm, the deflection of the beam was found increased significantly. Fig. 18 presents the load versus deflection of beam with varying span of 1000 and 1200 mm having opening at centre, top and bottom. The deflection of 1000 mm span beam having opening at centre, top and bottom was 4.6, 3.0 and 3.5 mm respectively. Similarly, the deflection of 1200 mm span deep beam having opening at centre, top and bottom was 8.78, 9.20 and 9.07 mm respectively. It has been observed that the deflection of 1200 mm span beam was found increased by 90, 200 and 160% with respect to location of openings at centre, top and bottom respectively, compared to 1000 mm span opening at centre, top and bottom. Table 9 shows the mid span deflection of beams of varying span viz. 1000, 1200 and 1800 mm. As expected, the deflection was found higher for beam having greater span. The deflection of beam having span 1200 and 1800 mm was found to increase by 90 and 490% respectively compared to 1000 mm span beam opening at centre. The reason may be due to deflection of the beam being proportional to the
264
K. Senthil, A. Gupta and S.P. Singh
180
200
(a) Load (kN)
120 90 60 B10200C(Span=1200mm)
30
(b)
200 160
Load (kN)
150 Load (kN)
240
240
160 120 80 B11-200T(Span=1200mm) B3-200T(Span=1000mm)
40
0
5 Deflection (mm)
10
80 B12200B(Span=1200mm)
40 0
0
0
(c)
120
0
5 Deflection (mm)
10
0
5 Deflection (mm)
10
Fig. 18 Load versus deflection of beams of varying spans having opening at (a) centre (b) top and (c) bottom Table 9 Mid span deflection of beams of varying span Designation of beam B1-200C B10-200C B18-200C B3-200T B11-200T B19-200T B5-200B B12-200B B20-200B
Span of beam (mm) 1000 1200 1800 1000 1200 1800 1000 1200 1800
Mid span deflection (mm) 4.6 8.8 27.0 3.0 9.2 29.0 3.5 9.1 14.0
length of the span. It was also observed that when the span of beam increases to 1800 mm the beam having openings at bottom of the shear span shows least deflection, 14 mm, whereas the beam having openings at centre and top was 27 and 29 mm respectively, see Table 9. Therefore, it is concluded that the beam having larger span and opening at bottom of the shear span may be preferred. 4.5 Shape of opening The shape of openings was varied as circular and square and their effect was studied in terms of load carrying capacity and deflection on deep beam. The beams with circular opening considered were B13-200C and B14-250C and compared with square opening B1-200C and B2-250C. Figs. 19 and 20 shows the deformed profile of beams with 200 and 250 mm diameter of circular opening, respectively. The vertical deflection of beam B1, B2, B13 and B14 was found 4.6, 6.1, 2.64 and 0.15 respectively. The vertical deflection of beam B14 was found insignificant i.e., 0.15 mm compared to the beam B13, i.e., 2.64 mm. It was observed that the size of square opening increased from 200 to 250 mm, the deflection of beam also increased from 4.6 to 6.1 mm, whereas due to circular opening the deflection was found to decrease from 2.64 to 0.15 mm. Figs. 21 and 22 compares the load versus deflection of beam with square and circular opening. The ultimate failure load of both the beams of 200 mm opening size was found almost same, 168 and 170 kN, see Fig. 21. Similarly, the ultimate failure load of both the beams of 250 mm opening size was found almost same, 113 and 108 kN, see Fig. 22. However, the deflection of beam with
265
Computation of stress-deformation of deep beam with openings using finite element method
Fig. 19 Deformed profile of beam B13-200C
Fig. 20 Deformed profile of beam B14-250C
150
100
120
80
Load (kN)
120
Load(kN)
180
90 60 B1-200C(Square Opening)
30
60 40 B14-250C(Circular Opening)
20
B13-200C(Circular Opening)
0
0 0
1
2 3 Deflection(mm)
4
5
0
2
4 6 Deflection (mm)
8
Fig. 21 Load versus deflection of the beam B1-200C Fig. 22 Load versus deflection of the beam B2-250C and B13-200C and B14-250C 180
Load (kN)
150 120 90 60 B1-200C(Shear Span to Depth Ratio=0.8m) B10-200C(Shear Span to Depth Ratio=1m) B7-200C(Shear Span to Depth Ratio=0.7m)
30 0 0
2
4 6 Deflection (mm)
8
10
Fig. 23 Load versus deflection of varying shear span to depth ratio
circular opening was found significantly less as compared to the beam with square opening. It was observed that the beam having circular opening had more stiffness and thus underwent less deflection. Therefore, it was concluded that the circular openings may be preferable than square openings in deep beams and similar results were confirmed by Alsaeq (2013). 4.6 Varying shear span to depth ratio
266
K. Senthil, A. Gupta and S.P. Singh
The shear span to depth ratio of the deep beam was varied and their effect was studied in terms of deflection and failure load of beam under same loading. The shear span to depth ratio has been calculated; B7 beam (0.4/0.55=0.7), B1 beam (0.4/0.5=0.8), B10 beam (0.5/0.5=1.0) and. The beams B7-200C, B1-200C and B10-200C had shear span to depth ratio 0.7, 0.8 and 1.0 respectively. Fig. 23 compares the load versus deflection of three beams each having openings at the centre of the shear span. The deflection of beam having shear span to depth ratio as 0.7, 0.8 and 1.0 was found 0.98, 4.60 and 8.72 mm respectively. From the Fig. 23, it was observed that an increase in shear span to depth ratio resulted in greater deflection. The reason may be due to the increase in shear span to depth ratio resulting in decrease in depth of the deep beam and greater deflection. These observations discourage using larger shear spans to depth ratio in deep beams.
5. Conclusions Three-dimensional finite element simulations has been performed in order to study the response of deep beam subjected to static monotonic loading using ABAQUS/CAE. Six reinforced concrete deep beams containing square openings were analysed numerically and compared with the available experimental results. In addition to that, seventeen beams were analysed to study the parameters namely location, size and shape of the opening and depth, span and shear span to depth ratio of the deep beam in terms of failure load and deflection and the following conclusions were drawn; In general, a maximum deviation of 6% has been found between the actual and predicted ultimate failure loads whereas a maximum deviation of 20% has been found between the actual and predicted vertical displacement. The simulations predicted the deformation profile accurately however, the chipping of the material could not be predicted in the simulations. The predicted stress contours also suggested very high stresses in the path along crack adjoining to the opening. The present study successfully demonstrates the accuracy and effectiveness of the finite element based numerical models of the deep beam with openings with the help of commercial finite element software. The deep beams with openings at the centre of the shear span underwent greater deflection and had lesser load carrying capacity than deep beams with openings at the top and bottom of the shear span. The reason behind this may be due to the maximum interception of the load path occurring when openings were provided at the centre of the shear span. Therefore, it was concluded that beams having openings in the centre of the shear span may be least preferable. The load carrying capacity of beams having opening of 200 and 250 mm at centre was found to be 170 and 108 kN respectively. In general, it was observed that increase in the opening size of the deep beam resulted in decrease in the load carrying capacities of the beam. An increase in opening size from 200 to 250 mm size resulted in an average shear strength reduction of 35%. The deflection of 550, 600 and 800 mm deep beam was found to decrease by 78, 91 and 95% respectively compared to 500 mm deep beam opening at centre. The reason may be due to the increase in stiffness of beam due to the increase in cross-sectional area of the beam and thus beam underwent less deflection. The deflection of beam having span 1200 and 1800 mm was found to increase by 90 and 490% respectively compared to 1000 mm span beam opening at centre. The beam span when was increased to 1800 mm, its opening at bottom of shear span showed least deflection (14 mm), whereas the same beam having openings at centre and top showed deflection of 27 and 29 mm
Computation of stress-deformation of deep beam with openings using finite element method
267
respectively. Therefore, it is concluded that the beam having larger span and opening at bottom of the shear span may be preferred. The size of square opening increased from 200 to 250 mm, the deflection of beam also increased from 4.6 to 6.1 mm, whereas due to circular opening the deflection was found to decrease from 2.64 to 0.15 mm. From this observation it was concluded that the circular openings may be preferable than square openings in deep beams. Also, it was observed that an increase in shear span to depth ratio resulted in greater deflection. The reason may be due to the increase in shear span to depth ratio results in decrease in depth of the deep beam and greater deflection. These observations encourage using smaller shear spans to depth ratio in deep beams.
References ABAQUS/explicit user‟s manual, version 6.14. Alsaeq, H.M. (2013), “Effects of opening shape and location on the structural strength of R.C. deep beams with openings”, Int. J. Civil Environ. Struct. Const. Arch. Eng., 7(6), 494-499. Campione, G. and Minafo, G. (2012), “Behaviour of concrete deep beams with openings and low shear span-to-depth ratio”, Eng. Struct., 41, 294-306. Chin, S.C. and Doh, S.I. (2015), “Behaviour of reinforced concrete deep beams with openings in the shear zones”, J. Eng. Tech., 6(1), 60-71. Demir, A., Ozturk, H. and Dok, G. (2016), “3D numerical modelling of RC deep beam behavior nonlinear finite element analysis”, Disast. Sci. Eng., 2(1), 13-18. Foster, S.J. (1990), “Non-linear finite element model for reinforced concrete deep beams and panels”, University of New South Wales. Foster, S.J. (1992), The Structural Behaviour of Reinforced Concrete Deep Beams, University of New South Wales. Hancock, J.W. and Mackenzie A.C. (1976), “On the mechanisms of ductile failure in high-strength steels subjected to multi-axial stress-states”, J. Mech. Phys. Solid., 24, 147-169. Hawileh, R.A., Maaddawy, T.A.E. and Naser, M.Z. (2012), “Nonlinear finite element modelling of concrete deep beams with openings strengthened with externally-bonded composites”, Mater. Des., 42, 378-387. Ibrahimbegovic, A. (1990) “A novel membrane finite element with an enhanced displacement interpolation”, J. Finite Elem. Anal. Des., 7, 167-179. Ibrahimbegovic, A. and Wilson, E.L. (1991), “Thick shell and solid finite elements with independent rotation fields”, Int. J. Numer. Meth. Eng., 31, 1393-1414. Iqbal, M.A., Rai, S., Sadique, M.R. and Bhargava, P. (2012), “Numerical simulation of aircraft crash on nuclear containment structure”, Nucl. Eng. Des., 243, 321-335. Iqbal, M.A., Senthil, K., Bhargava, P. and Gupta, N.K. (2015), “The characterization and ballistic evaluation of mild steel”, Int. J. Impact Eng., 78, 98-113. Islam, M.R., Mansur, M.A. and Maalej, M. (2005), “Shear strengthening of RC deep beams using externally bonded FRP systems”, Cement Concrete Compos., 27(3), 413-420. Johnson, G.R. and Cook, W.H. (1983), “A constitutive model and data for metals subjected to large strains, high strain rates and high temperatures”, Proceedings of 7th International Symposium on Ballistics, The Hague, Netherlands. Johnson, G.R. and Cook, W.H. (1985), “‟Fracture characteristics of three metals subjected to various strains, strain rates, temperatures, and pressures”, Eng. Fract. Mech., 21, 31-48. Kim, H.S., Lee, M.S. and Shin, Y.S. (2011), “Structural behaviours of deep RC beams under combined axial and bending force”, Proc. Eng., 14, 2212-2218. Maaddawy, T.E. and Sherif, S. (2009), “FRP composites for shear strengthening of reinforced concrete deep
268
K. Senthil, A. Gupta and S.P. Singh
beams with openings”, Compos. Struct., 89(1), 60-69. Mansur, M.A. (1998), “Effect of openings on the behaviour and strength of R/C beams in shear”, Cement Concrete Compos., 20(6), 477-486. Mohamed, A.R., Shoukry, M.S. and Saeed, J.M. (2014), “Prediction of the behavior of reinforced concrete deep beams with web openings using the finite element method”, Alexandria Eng. J., 53, 329-339. Rashid, M.A. and Kabir, A. (1996), “Behaviour of reinforced concrete deep beam under uniform loading”, J. Civil Eng. Inst. Eng., 24(2), 155-169. Sachan, A.K. and Rao, K. (1990), “Behaviour of fibre reinforced concrete deep beams”, Cement Concrete Compos., 12(3), 211-218 Senthil, K., Rupali, S. and Satyanarayanan, K.S. (2017), “Experiments on ductile and non-ductile reinforced concrete frames under static and cyclic loading”, J. Coupl. Sys. Multisc. Dyn., 5(1), 38-50. Senthil, K., Satyanarayanan, K.S. and Rupali, S. (2016a), “Energy absorption of fibrous self-compacting reinforced concrete system”, Adv. Concrete Constr., 4(1), 37-47. Senthil, K., Satyanarayanan, K.S. and Rupali, S. (2016b), “Behavior of fibrous reinforced concrete systems subjected to monotonic and cyclic loading”, Proceedings of the 10th Structural Engineering Convention, CSIR-SERC, Chennai, India, December. Winnicki, A. and Cichon, C. (1995), “Modelling problems of RC deep beams using FEM”, Proceedings of the XII Polish Conference on Computer Methods in Mechanics, Poland, May. Yang, K.H. and Ashour, A.F. (2007), “Structural behaviour of reinforced-concrete continuous deep beams with web openings”, Mag. Concrete Res., 59(10), 699-711. Yang, K.H., Chung, H.S., Lee, E.T. and Eun, H.C. (2003), “Shear characteristics of high-strength concrete deep beams without shear reinforcements”, Eng. Struct., 25(10), 1343-1352. Yang, K.H., Eun, H.C. and Chung, H.S. (2006), “The influence of web openings on the structural behaviour of reinforced high-strength concrete deep beams”, Eng. Struct., 28(13), 1825-1834. Yoo, D.Y. and Banthia, N. (2015), “Numerical simulation on structural behavior of UHPFRC beams with steel and GFRP bars”, Comput. Concete, 16(5), 759-774. Zhao, Z.Z., Kwan, A.K.H. and He, X.G. (2004), “Nonlinear finite element analysis of deep reinforced concrete coupling beams”, Eng. Struct., 26(1), 13-25.
CC